Thermal Remote Sensing
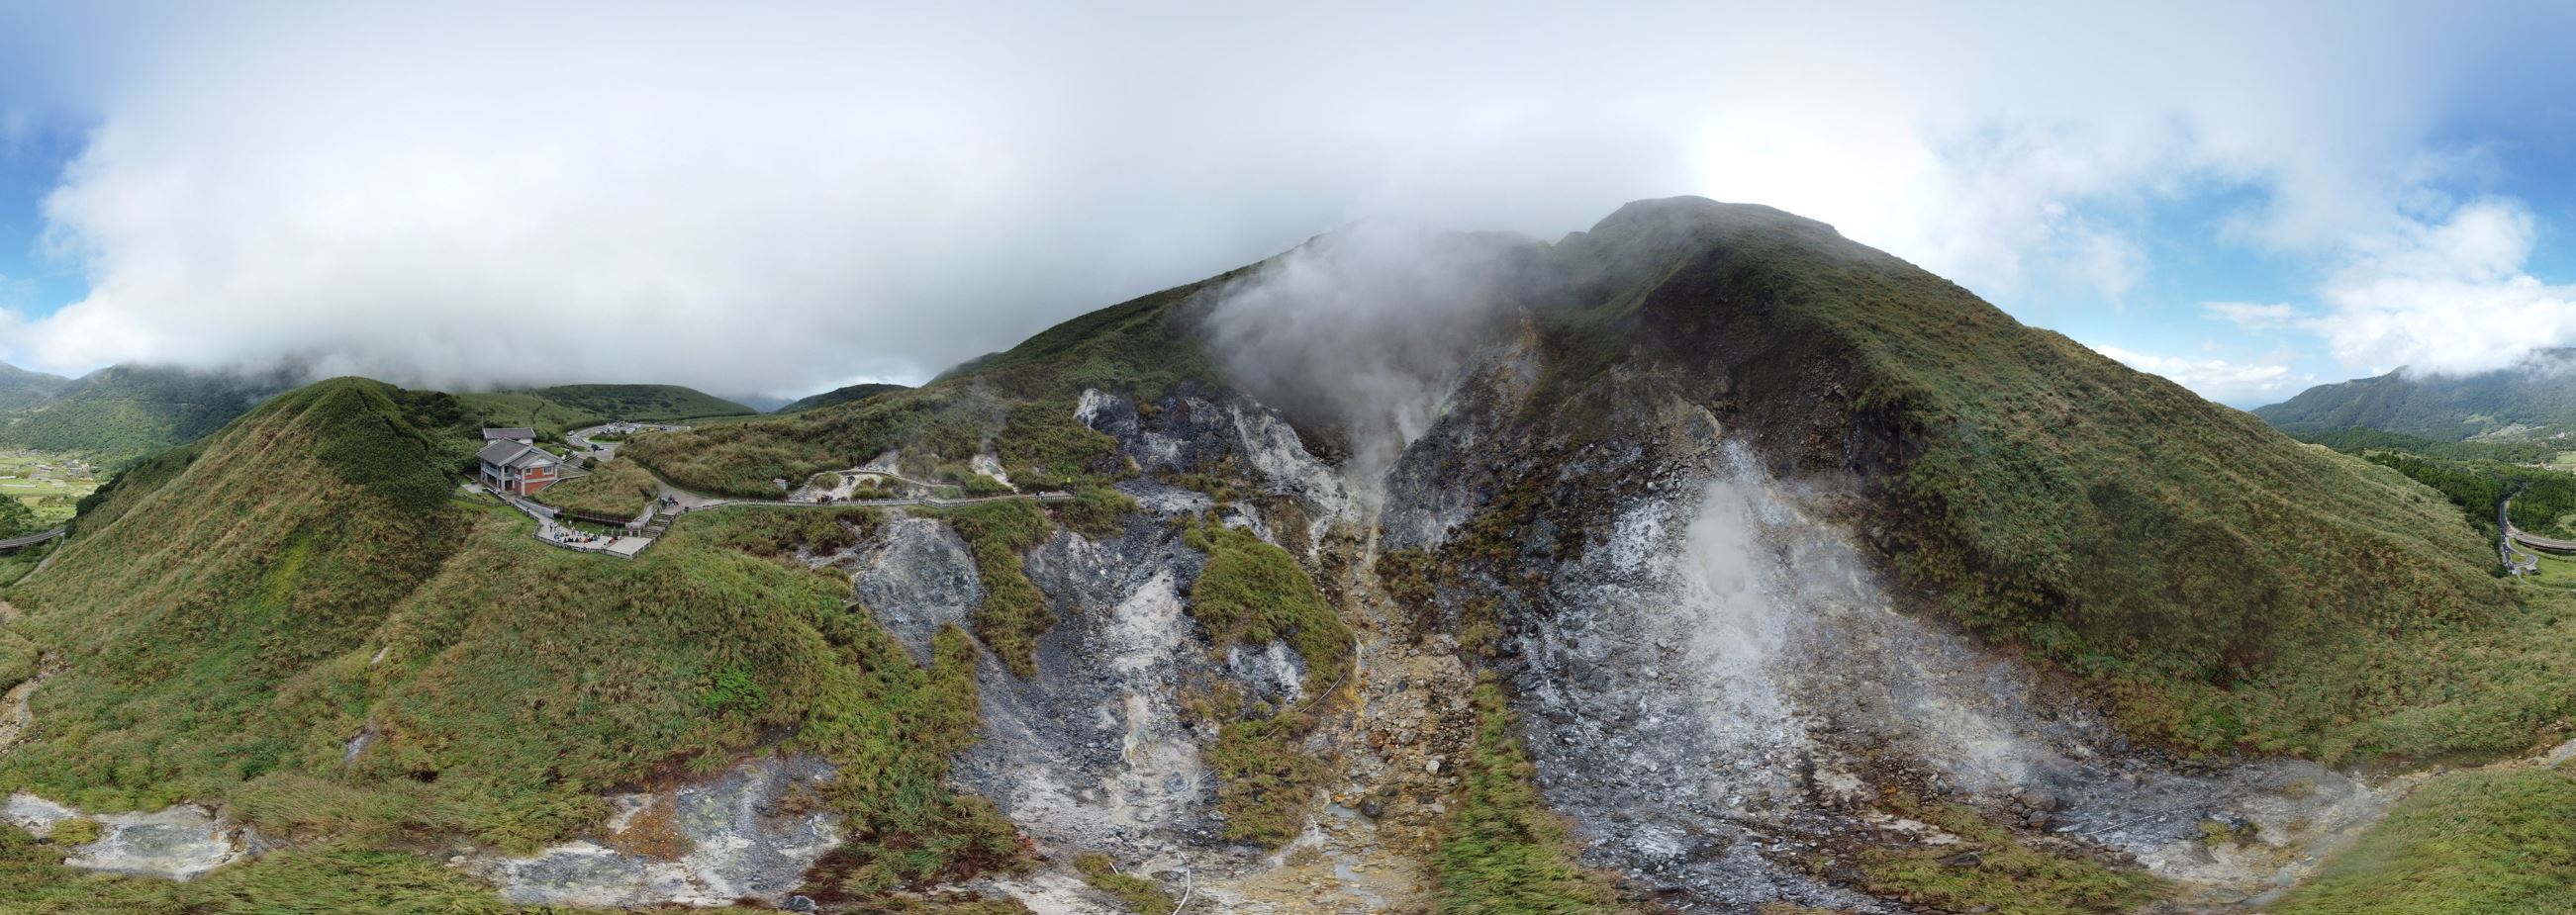
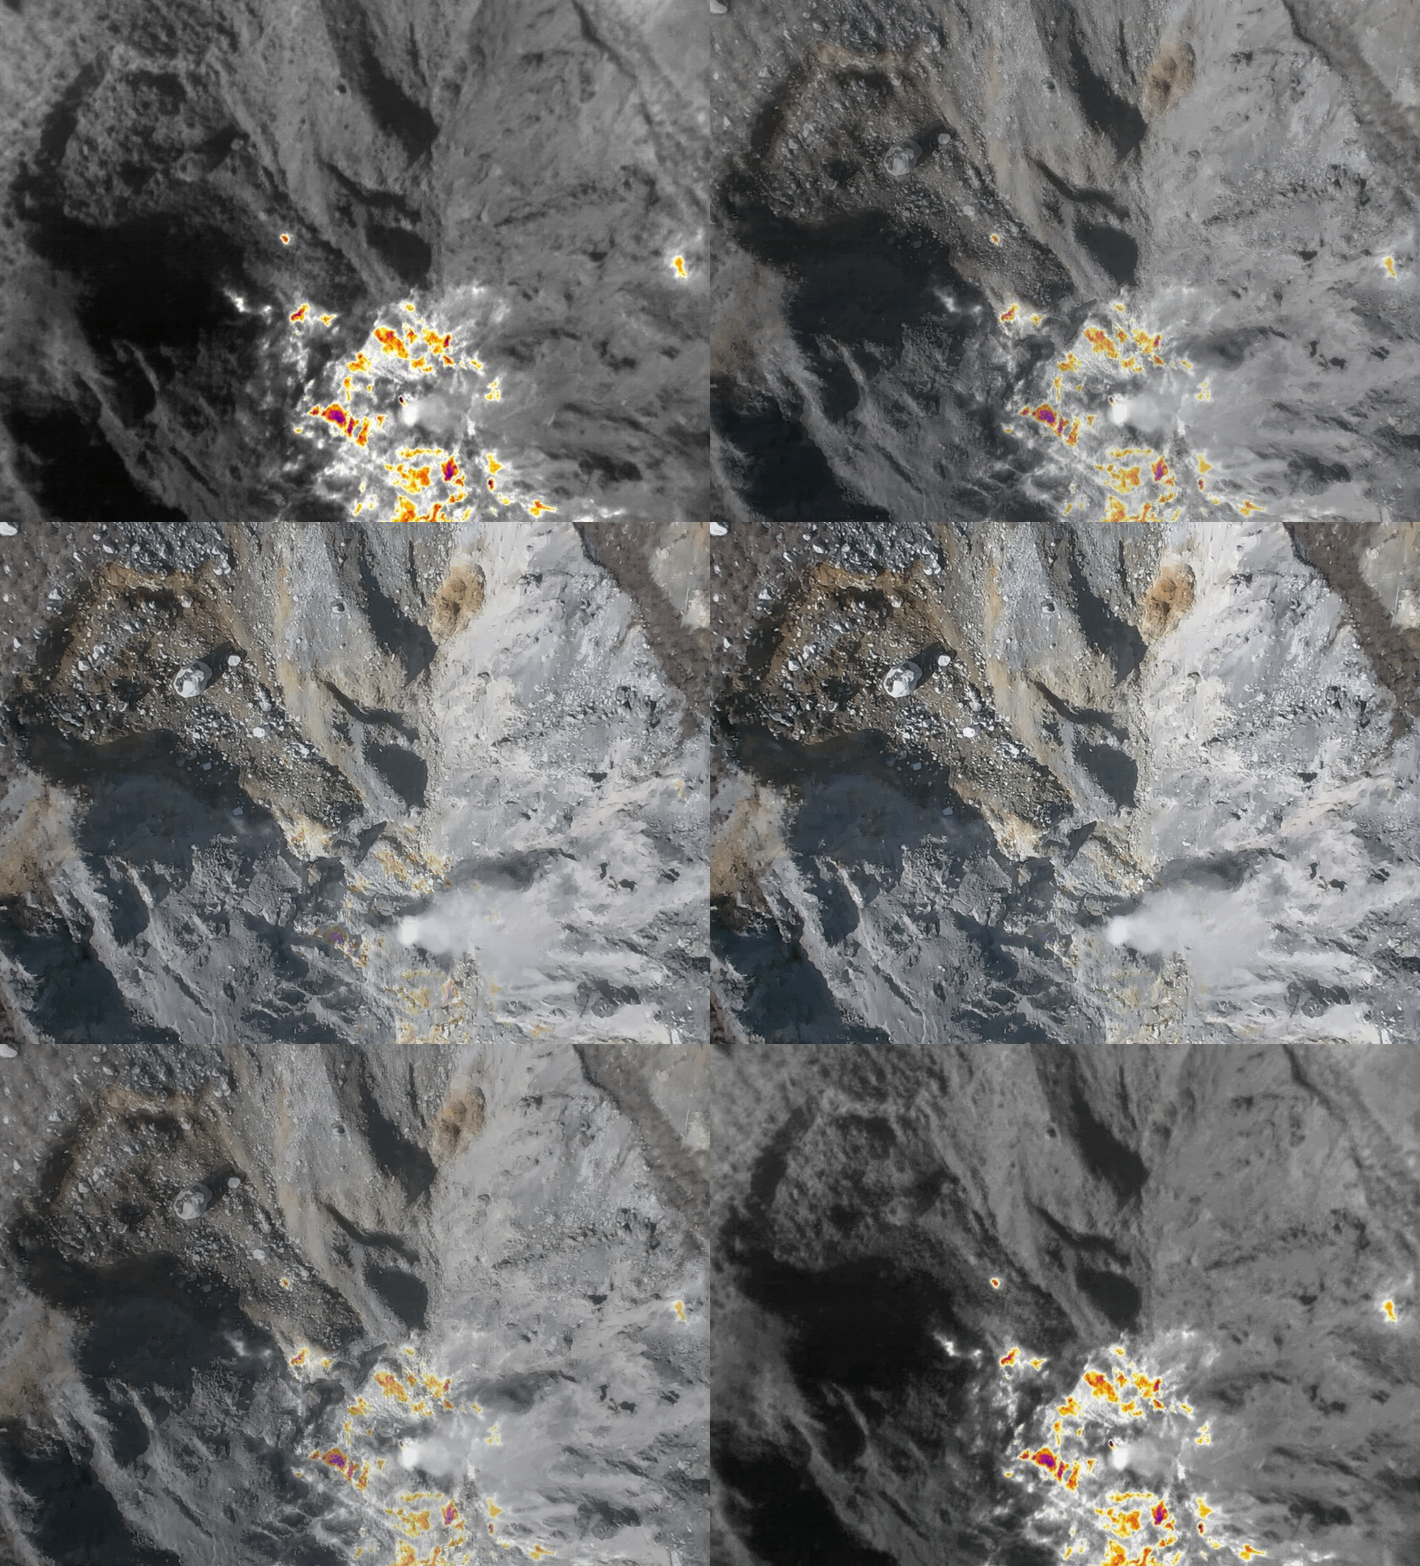
Image: Demostration of high-resolution UAV thermal and visible-light imagery of the Dayoukeng Crater, Tatun Volcano Group in Taipei (acquired by SRLab)
Thermal Remote Sensing of Volcanic and Geothermal Systems in Taiwan
From Long-Term Satellite Observations to UAV-Based Heat-Loss Mapping
In recent years, I have participated in research associated with the Tatun Volcano Observatory (TVO). Working closely with postdoctoral researcher Dr. Hai-Po Chan and Ph.D. student Cheng-Wei Sun, we have explored how satellite and UAV thermal infrared observations can be used to understand the distribution of surface temperatures associated with Taiwan’s volcanic and geothermal systems.
This series of studies began with long-term satellite observations of Kueishantao (KST) and the Tatun Volcanic Group (TVG). It subsequently expanded to high-resolution UAV thermal mapping of geothermal areas within the Tatun Volcanic Group and multi-temporal assessment of surface temperatures and geothermal anomalies across Taiwan.
Our initial studies used multi-temporal Landsat, ASTER, and MODIS data to examine the spatial distribution and long-term variations of land surface temperature at Kueishantao and Tatun. Satellite observations of Kueishantao from 1999 to 2022 revealed persistent surface thermal anomalies concentrated mainly in the southeastern part of the island. Their distribution broadly corresponds to the location of subsurface volcanic and geothermal activity inferred from previous geological and geophysical studies. [Article Link 1]
For the Tatun Volcanic Group, approximately four decades of satellite-derived surface temperatures were compared with around three decades of earthquake records to explore possible relationships between surface thermal variations and subsurface volcanic or hydrothermal processes. [Article Link 2] These studies show that long-term satellite archives can provide observational records extending well beyond the duration of most field-monitoring programs, thereby contributing to our understanding of long-term variations in volcanic and geothermal systems. The results published in the international journal also attracted attention through a NASA feature article.
Our research subsequently progressed from regional-scale satellite observations to some of the most active geothermal areas in the Tatun Volcanic Group. We conducted a UAV survey near dawn to minimize the effects of solar heating. The UAV thermal images revealed fine-scale thermal heterogeneity that could not be resolved by Landsat. Although the two datasets produced substantially different maximum surface temperatures and peak radiative heat fluxes, their estimates of geothermal radiative heat loss were comparable. This comparison demonstrates the complementary strengths of the two approaches: satellite imagery is suitable for rapidly characterizing regional thermal anomalies and total heat loss, whereas UAV observations can resolve individual fumaroles, heated ground, and spatial variations in surface heat flux in much greater detail. [Article Link 3]
Our latest study extends the analysis to the entire island of Taiwan. Landsat thermal infrared data acquired in 2001, 2015, and 2025 were used to construct multi-temporal mosaics of land surface temperature and examine persistent surface thermal anomalies. The resulting maps clearly delineate known geothermal regions, including the Tatun Volcanic Group, Ilan Plain, Lushan, and Huatung areas, while also identifying other thermal anomalies that warrant further investigation. [Article 4: in press]
At the island-wide scale, however, distinguishing geothermal signals from the effects of elevation, vegetation, weather conditions, land-cover change, and urban heat islands remains an important challenge. Surface-temperature anomalies should therefore not be interpreted in isolation but evaluated together with geological, geophysical, geochemical, and field observations.
Taken together, this series of studies establishes a multiscale framework for thermal remote sensing, encompassing decades of satellite observations, preliminary island-wide geothermal assessment, centimeter-scale UAV thermal mapping, and quantitative estimation of geothermal heat loss. The primary significance of this work lies in connecting observable surface-temperature patterns with volcanic and geothermal processes occurring beneath the surface.
With careful consideration of environmental and anthropogenic influences, thermal remote sensing can help identify persistent thermal anomalies, guide field investigations of geothermal resources, quantify geothermal heat discharge at the surface, and provide supporting information for volcanic monitoring and geothermal-resource assessment. By integrating observations across different spatial scales and sensing platforms, this approach can continue to provide an effective framework for investigating Taiwan’s volcanic and geothermal systems and supporting the sustainable development of geothermal energy.
臺灣火山與地熱系統之熱遙測研究
從長期衛星觀測到無人機地熱損失量測
近年來,我參與大屯火山觀測站(Tatun Volcano Observatory, TVO)的相關研究工作,我與博士後研究人員詹海柏博士與博士生孫正瑋密切合作,探討如何運用衛星與無人機熱紅外觀測,了解臺灣火山及地熱系統的地表溫度分布。這一系列研究最初以龜山島(Kueishantao, KST)及大屯火山群(Tatun Volcanic Group, TVG)的長期衛星觀測為主,之後進一步發展至大屯火山群地熱區的高解析度無人機熱影像測繪,以及全臺灣多時期地表溫度與地熱異常評估。
最初的研究利用Landsat、ASTER及MODIS等多時期衛星資料,分析龜山島與大屯火山群地表溫度的空間分布及長期變化。龜山島1999至2022年的衛星觀測顯示,持續性的地表熱異常主要集中於島嶼東南側,與先前地質及地球物理研究所推測的地下火山與地熱活動位置大致相符。 [Article Link 1]
大屯火山群的研究則比較約40年的衛星地表溫度與約30年的地震紀錄,探討地表熱變化與地下火山或熱液作用之間可能存在的關係 [Article Link 2]。這些成果顯示,長期衛星資料庫可提供遠超過一般野外監測時間尺度的觀測紀錄,有助於了解火山與地熱系統的長期變化。此研究工作發表於國際期刊的成果受到NASA的科普報導 [Report Link]。
後續研究由區域尺度的衛星觀測,進一步發展至大屯火山群中地熱活動最為顯著的區域。我們於接近日出時進行無人機調查,以降低太陽輻射加熱的影響。無人機影像呈現出Landsat無法解析的細微熱異質性。雖然兩種資料所得到的最高地表溫度及最大輻射熱通量有明顯差異,但估算的地熱輻射熱損失相當接近。這項比較顯示兩種觀測方法具有互補性:衛星影像適合快速掌握區域尺度的熱異常與總體熱損失,無人機則能更細緻地解析局部噴氣孔、受熱地表及熱通量的空間變化。[Article Link 3]

圖:大屯火山群大油坑地區無人機載熱影像鑲嵌成果圖 (共1857張熱影像,原始解析度約13 cm)
我們最新的研究則將分析範圍擴展至全臺灣,利用2001、2015及2025年的Landsat熱紅外資料建立多時期地表溫度鑲嵌圖,並分析持續性的地表熱異常。成果清楚呈現大屯火山群、宜蘭平原、廬山及花東地區等已知地熱區,也指出其他值得進一步調查的熱異常區域。[Article Link 4]
然而,在全島尺度的分析中,如何區分地熱訊號與高程、植被、氣象條件、土地利用變化及都市熱島效應,是一項重要挑戰。因此,地表溫度異常不宜單獨解釋,而應與地質、地球物理、地球化學及野外調查資料相互驗證。
整體而言,這一系列研究建立了多尺度的熱遙測分析架構,涵蓋數十年的衛星觀測、全臺灣地熱潛勢初步評估,以及公分尺度的無人機熱影像與地熱損失量化。這些研究的主要意義,在於嘗試將可觀測的地表溫度分布,與地下的火山及地熱作用相互連結。
在審慎考量環境及人為影響的前提下,熱遙測可協助辨識持續性的熱異常、規劃野外熱資源調查、量化地表地熱,並為火山監測及地熱資源評估提供輔助資訊。這套整合不同尺度與觀測平台的方法,可持續作為研究臺灣火山與地熱系統,以及支持地熱能源永續發展的有效架構。